


Introduction
Arcadia is a historically diverse city in the San Gabriel Valley region of eastern Los
Angeles County. The famous Route 66 and the busy 210 Freeway cut the city in two. With a community hovering over 56,000, it is among the leading cities in the United States with a majority Asian population (64.9%). As with other cities along the foothills of the San Gabriel Mountains, it has transformed into a hub of real estate development in recent years. Business Insider ranked Arcadia as the fifth priciest housing market in the US. Interestingly, these newly-built single-family homes (that lay on even bigger plots of land) have seemingly been restricted to north of the 210 Freeway, along the base of the mountain range. By creating these maps, I explored my preconceived idea of Arcadia: that the northern part of the city was more affluent than the southern. In visualizing poverty in Arcadia and the nearby San Gabriel Valley, it prompted me to investigate how the 210 Freeway’s air pollution affects the local population’s health.
Map 1: Poverty and Demography
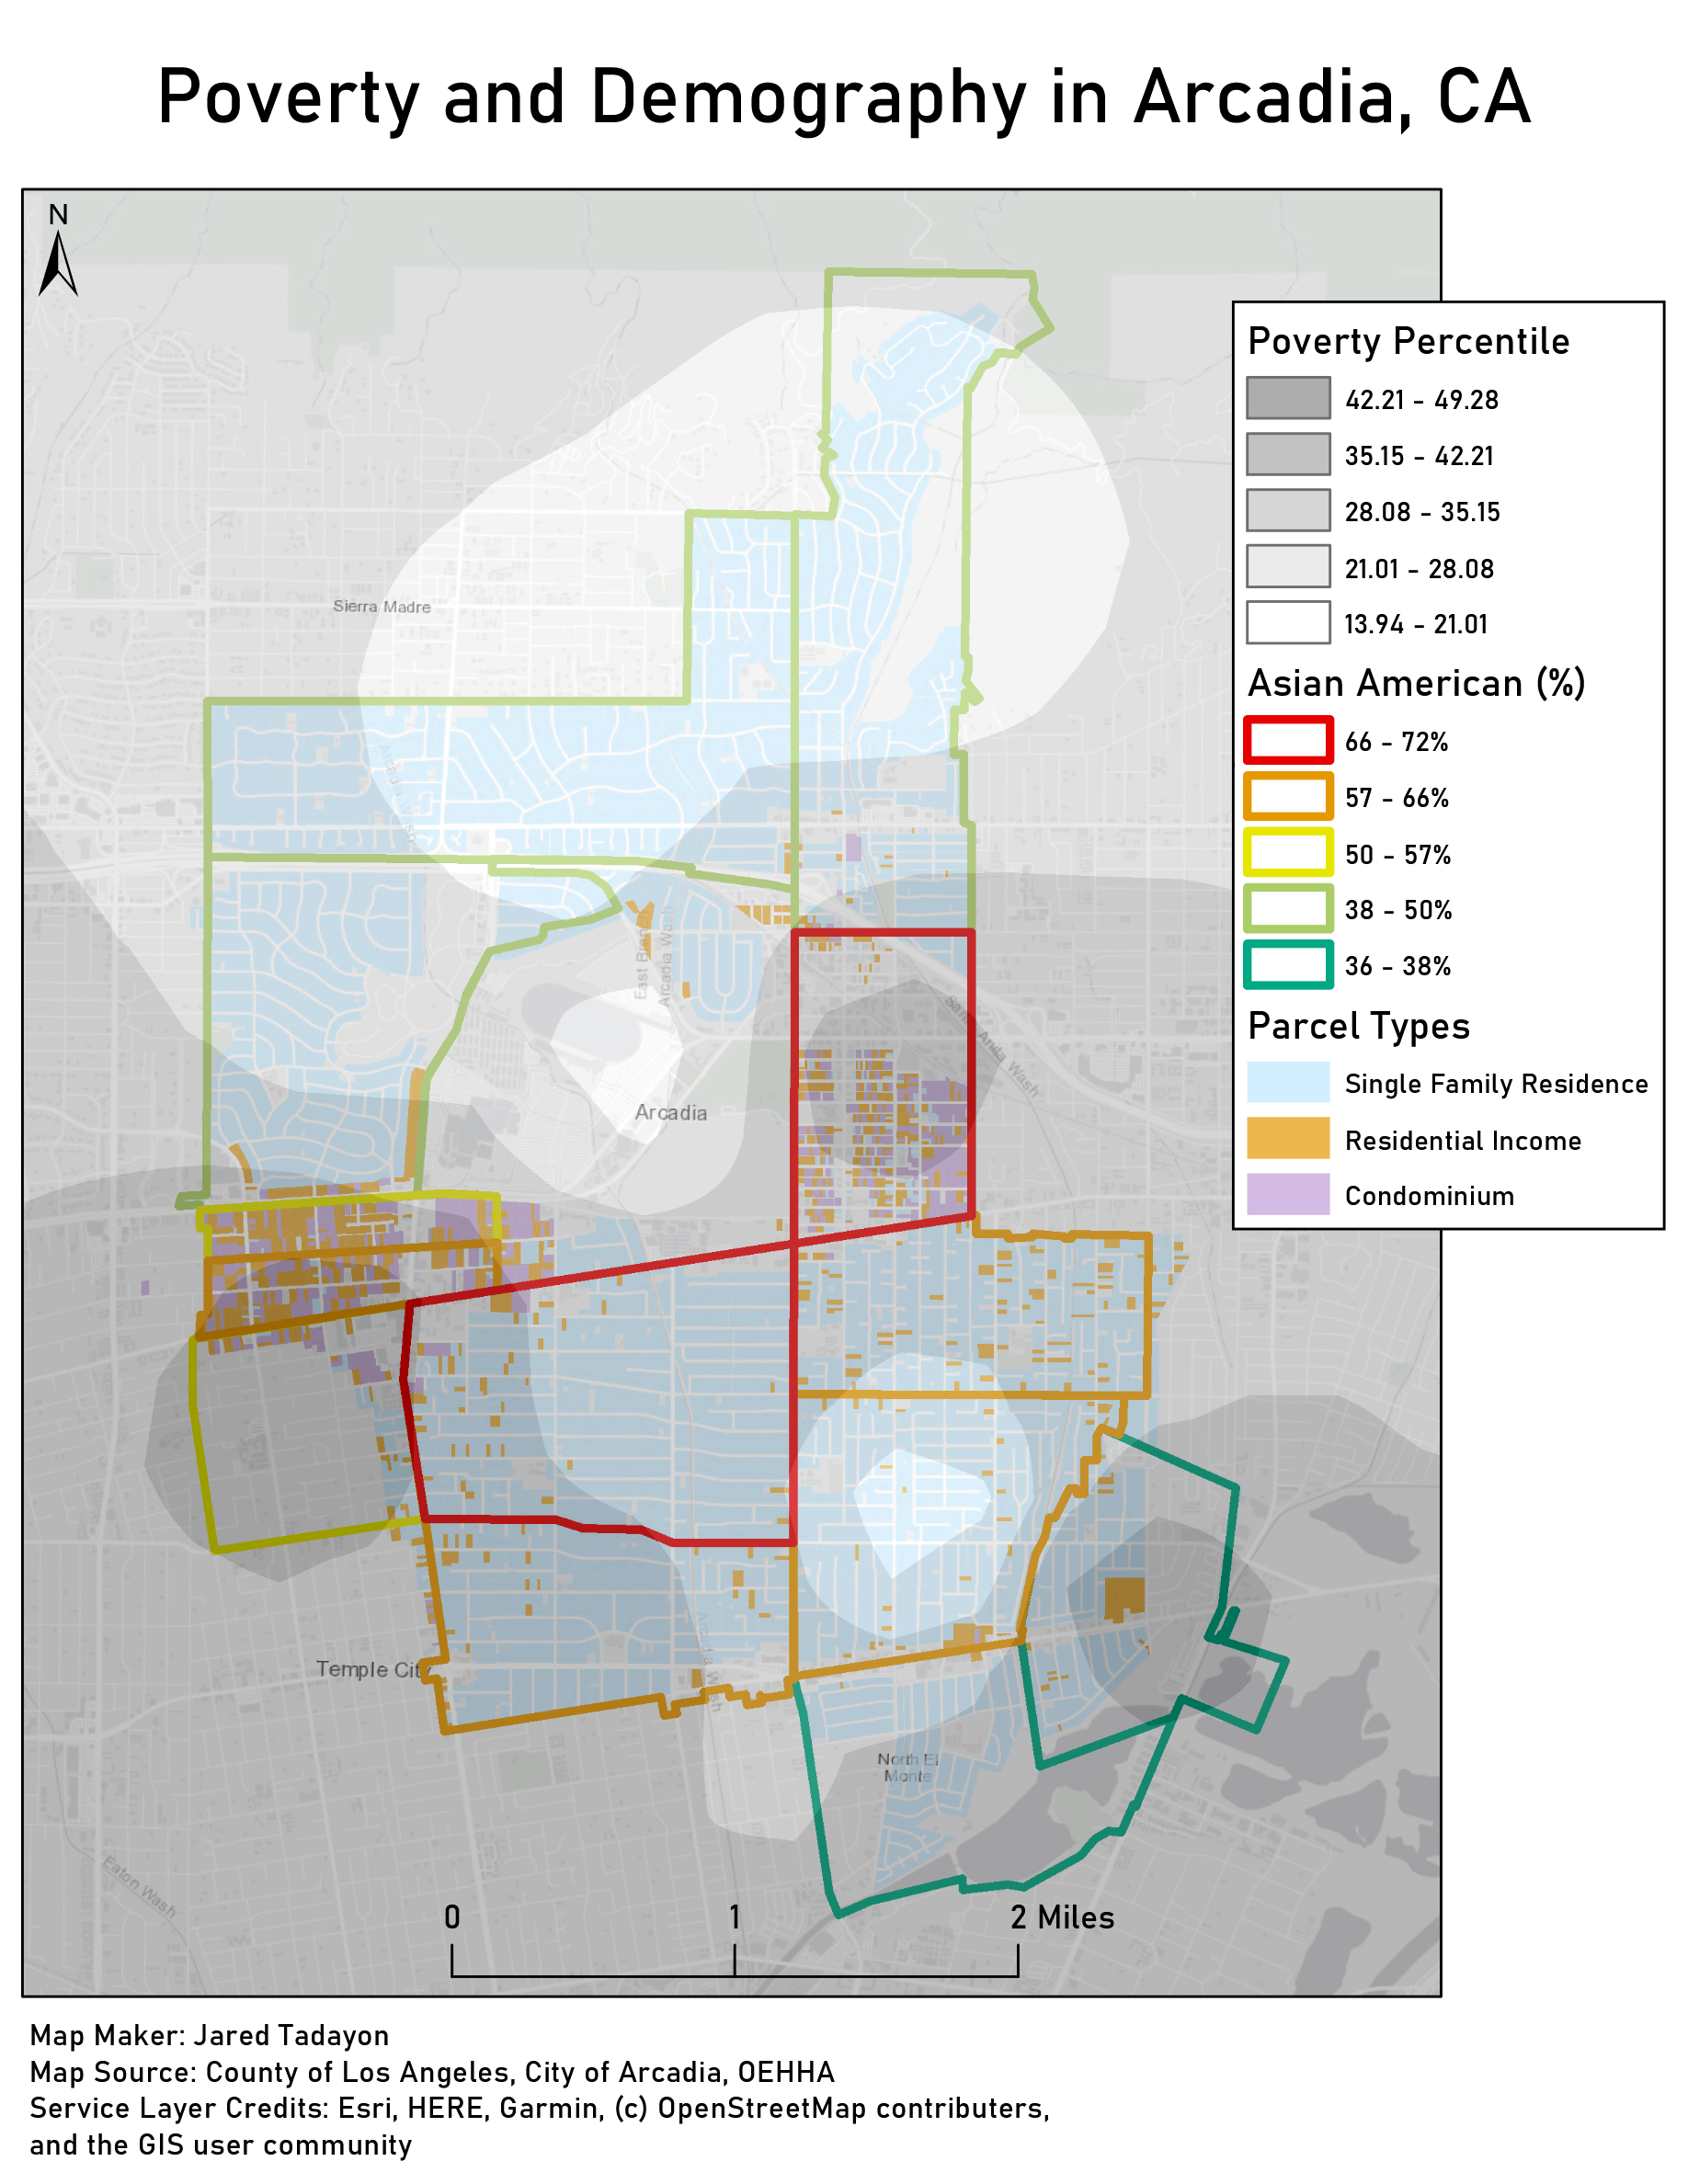
The first map visualizes the poverty percentile of each census block in Arcadia, the type of homes by parcel, and the percentage of Asian Americans who live in each census block. The first layer that I found was a shapefile of Arcadia by parcel type. It was made by the City of Arcadia. Using a definition query, I only kept “Single Family Residence”, “Residential Income”, and “Condominium”. On the CalEnviroScreen website, I found the recently published OEHHA, The Office of Environmental Health Hazard Assessment. I inserted their available shapefile onto the map, and duplicated it. To show the percentage of Asian Americans in each census block of Arcadia, I used a definition query to limit the space to the city’s boundaries. By utilizing the Symbology tool (graduated colors) to show the demographics through a colorful border, it was kept hollow so the parcels could remain visible. The duplicate of the OEHHA shapefile was used to display the poverty percentile. After restricting it to Arcadia, the Feature to Point tool in the Database Management section of the ArcToolbox came in handy. I then used the IDW tool in the Spatial Analyst section to display the poverty percentile. In order for the other layers to be visible, I changed the color of the Poverty Percentile layer to Black-White and raised transparency. A gray basemap was added to show the surrounding area and neighboring cities.
The results seem quite compelling from the outset. Take a look at the top half of the map (the light green and dark red) – you will notice that areas with a 38-50% Asian American population place very low on the poverty percentile, while the dark red areas with 66-72% Asian American population place medium to high on the poverty percentile. Areas with single-family residences placed on the lower end of the poverty percentile, while areas with condominiums and residential income placed on the higher end.
Map 2: Poverty and Asthma
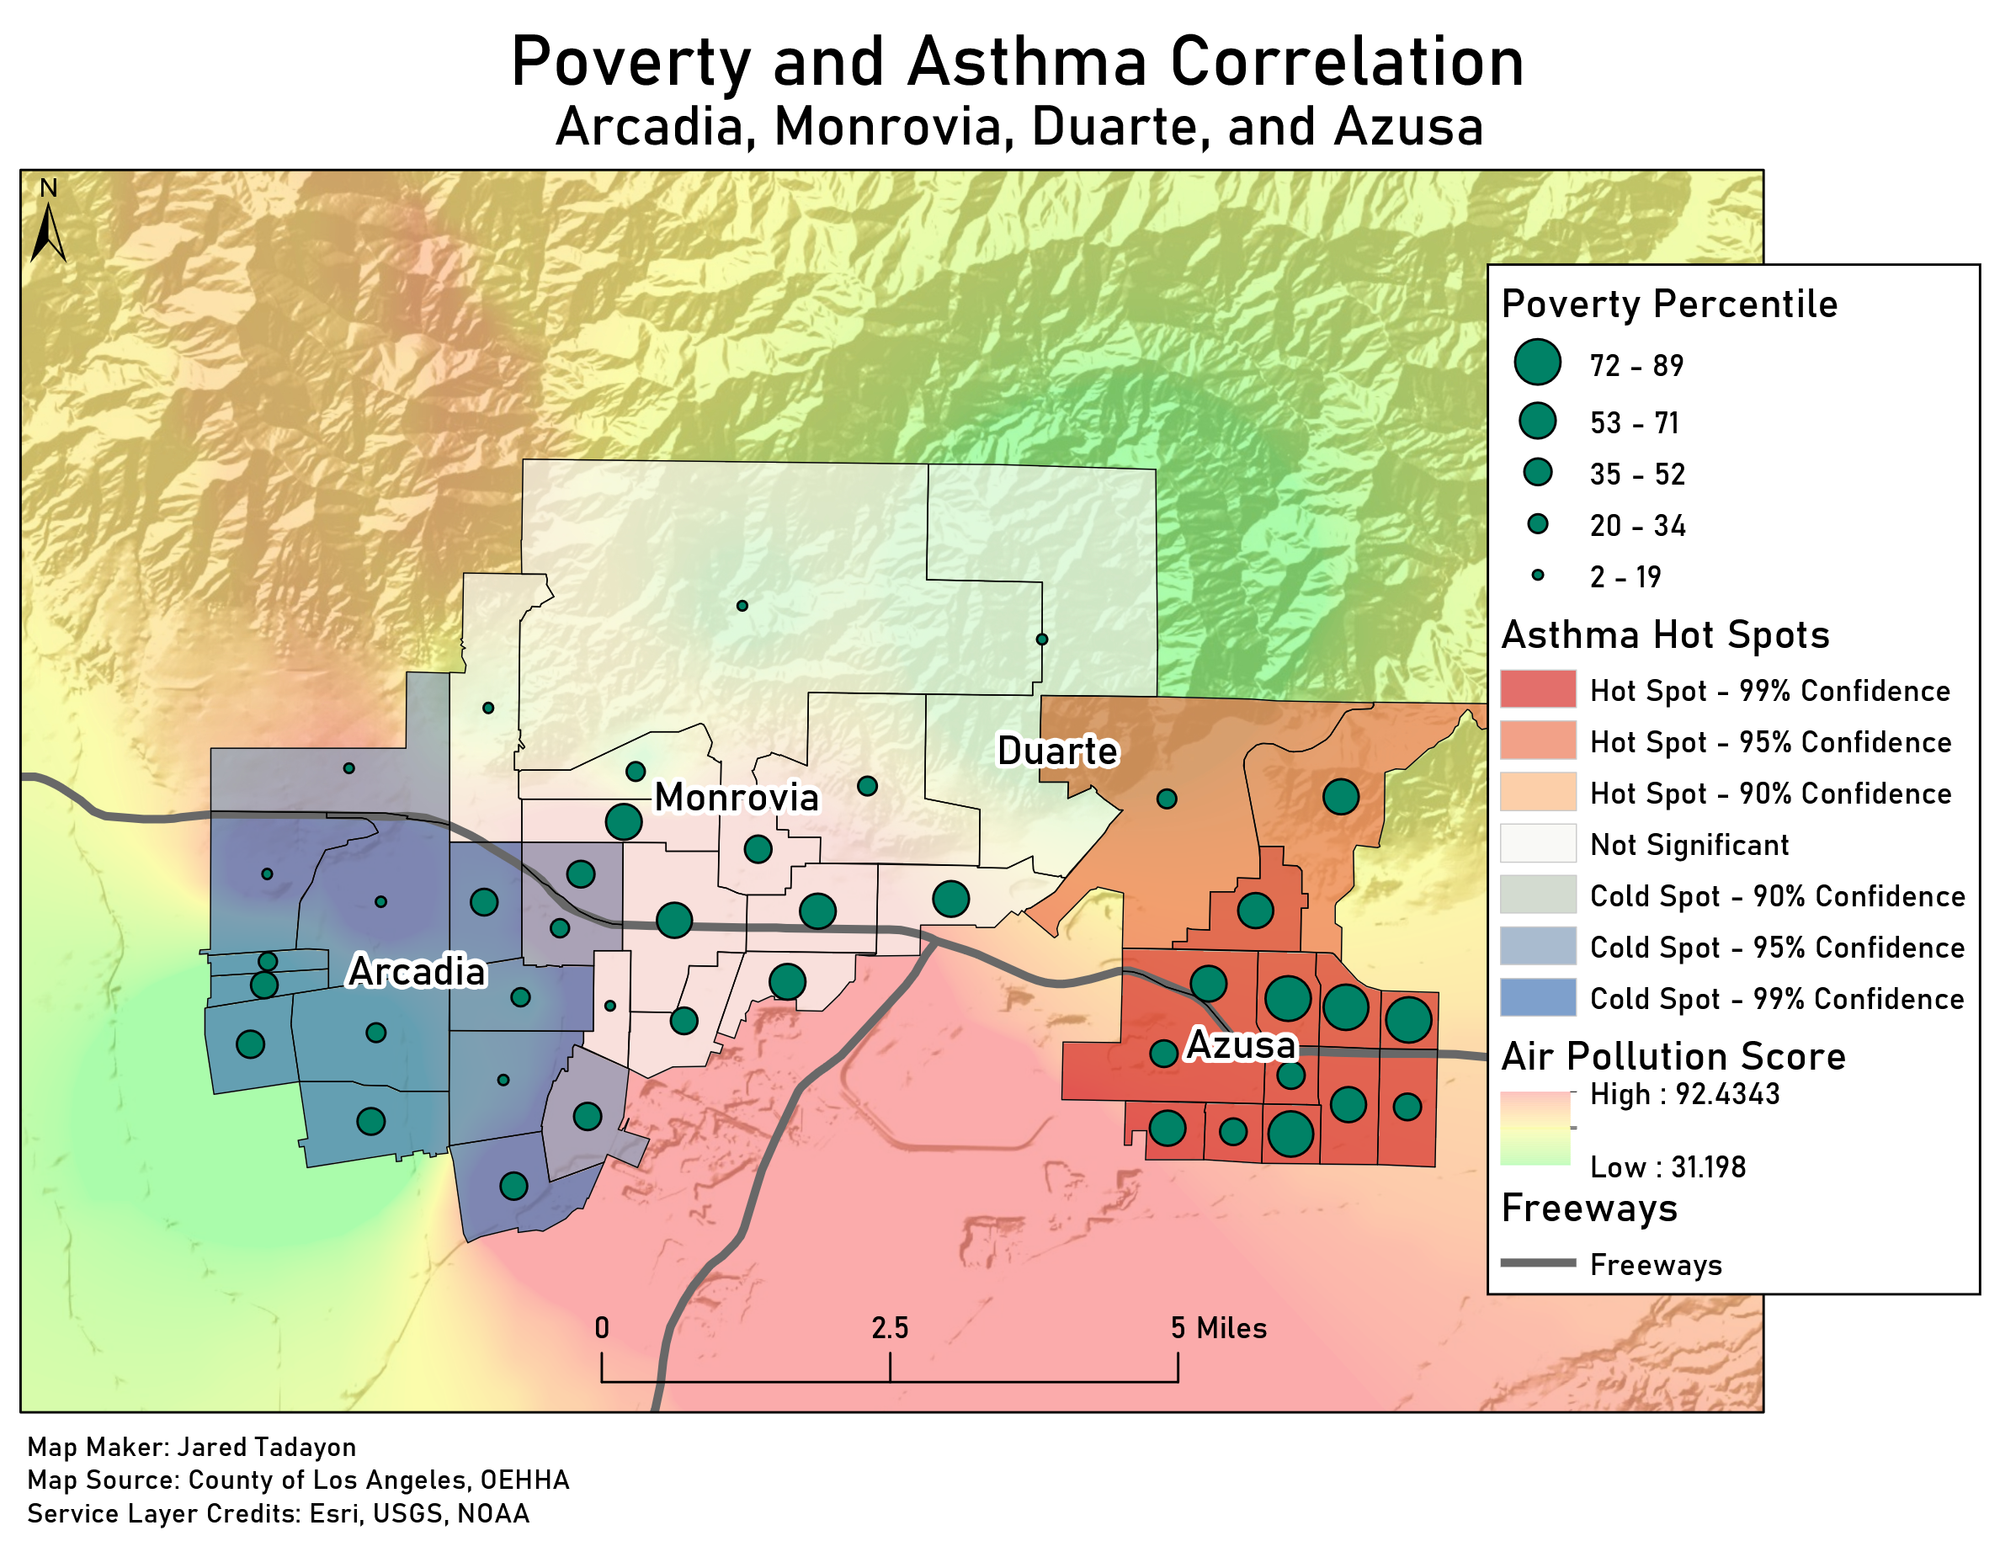
The second map visualizes poverty and asthma hot spots in Arcadia, Monrovia, Duarte, and Azusa. I had originally wanted to limit the map to Arcadia, but after seeing how the asthma rates were much too similar throughout the city, I expanded the map to show neighboring cities. The first step was to use the OEHHA shapefile and create a definition query that only displayed the four cities. Then, I used the Getis-Ord Gi Hot Spot Analysis to show Hot Spots and Cold Spots for asthma rates. For the Poverty Percentile, I could not reuse the Feature to Point shapefile from Map 1 because it only showed Arcadia, so I redid the process in order to show the four cities. To visualize the region’s air pollution, I used another OEHHA shapefile. Although this time around, since I needed to learn the air pollution scores in the greater San Gabriel Valley, no spatial boundaries were created. This was accomplished with the IDW tool. An interstate highways shapefile was inserted to show the 210 West freeway, which passes through all four cities.
The results paint a picture of how health, air pollution, and poverty coalesce. Across the four cities, poverty rates are shown to be highest in Monrovia and Azusa, especially near the 210 Freeway. As for the asthma hot spots, Azusa takes the spot for the greatest number of cases. Air quality appears to be a common problem across the board. In Arcadia, the red (which indicates high air pollution) can be seen encapsulating the 210 Freeway.