


Introduction
CityScore is a data aggregator and dashboard built by the Citywide Analytics Team of Boston, Massachusetts to assess the performance of the city. It plays a critical role in the Mayor’s Dashboard – a compilation of connected systems used by city officials to see how the city is operating on a daily basis. The dashboard highlights the different reasons why Bostonians contact 311 (parking, potholes, and street light failures). Additionally, it features EMT response times, public library attendance, and public safety statistics (violent incidents and homicides). The dashboard records these patterns as well as the performance of municipal agencies over the course of a day, week, month, and quarter, providing the Mayor with both a short- and long-term picture of the city's well-being and government performance. CityScore is a model composed of 23 metrics that are routinely given a score. Every day, all of those lesser scores add up to one significant number: the city score. 1.25 is considered a great score, while anything less than a 1 is a red flag. Boston Mayor Marty Walsh’s then-Chief of Staff, Daniel Koh, came up with the idea after years of working in baseball analytics. After news of the proposed scoring model was made public in 2015, Boston’s Citywide Analytics Team went full steam and created CityScore in under a year.
The tool has inspired other cities to create their own open dashboards with similar models, ontologies, and values in design. As it stands, CityScore has room for improvement: the model should address algorithmic blind spots, utilize a fluid-based ontology, and develop complementary data visualization technologies.
The CityScore Model
CityScore is a dynamic and algorithmic data aggregator. It combines open data from a variety of metrics to calculate the score. Because it is automatic, the only human interaction that is required are the inputs, or metrics, and mathematical expressions to weigh them against each other. Cathy O’Neil researched many types of models in her book Weapons of Math Destruction. She explains models as abstract representations of processes to predict responses in different scenarios. The team chooses what is significant enough to be put in a model in order to uncover critical facts, statistics, and behaviors. Models simulate a scaled-down version of the world so that it can be better understood.
Metric Logic
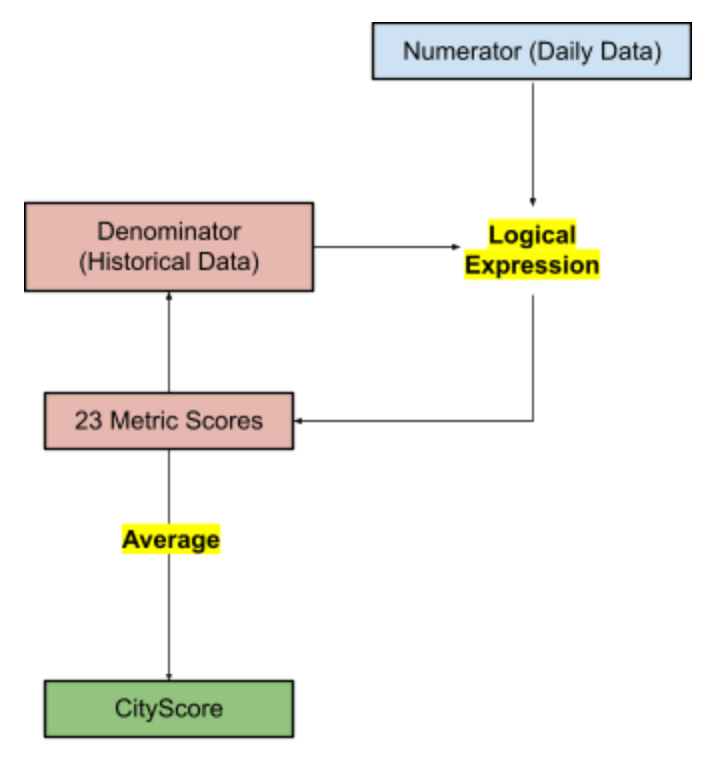
Models require inputs - in the case of the city, factors such as crime, car accidents, and infrastructure failures are useful indicators for determining the overall well-being. When adjustments and updates are made to the model, it becomes dynamic. This “dynamic model” can be trained to have more precise measures of predictiveness by continually inputting more data (O’Neil 25). City officials input data into the CityScore application under the categories “Numerators” or “Current Average”. Each metric is given a standardized “Denominator” or “Historical Average”, as well as a logical expression and a target. CityScore uses four types of
expressions depending on the metric:
(1) “average(sum(numerator_value)/sum(denominator _value))/target”;
(2) “sum(numerator_value)/sum( denominator_value)/target”, “target / median”;
(3) “historical_average / current_average”;
(4) “current_average / historical_average”.
The Boston Public School (BPS) Attendance metric uses the first expression listed, and as of the day this is written, the most recent data shows a Numerator of 20088 and a Denominator of 20190. With 102 students not attending classes that day, the metric received a score of 1.04, which is considered by the city as perfect (“CityScore Full Metric List.”). From then on, the overall city score is derived from an average of the 23 individual metric scores.
Parameters
All 23 metrics used by CityScore have parameters in the form of success rates, weights, and time. An accurate model would need parameters, or rules, that can attempt to eliminate human biases through a systematized approach to defining the extent that a metric should pass or should not pass (O’Neil 26). The essence of models are simplifications, thus there may regularly be imperfections. No model can capture all of the complexities of the actual world. The two primary categories of goals are percentages and “CityScore greater than 1”. Three metrics aim for a 95% success rate, including Emergency Medical Services (EMS) response times, 311 Call Performance Center, and Boston Public School (BPS) Attendance. One metric, BFD Response Time, aims for a 90% success rate. The 10 metrics that aim for an 80% success rate are related to city infrastructure, such as Pothole Repair On-Time % and Tree Maintenance On-Time %. The six metrics that aim for a “CityScore greater than 1” are all related to crime, such as stabbings and shootings, and are weighted against the historical average. Most of the 23 metrics are supplemented with a time or date, which are performance measurements. Dates are more varied than the weights due to the demanding and time consuming nature of some metrics over others. Take for instance the metrics that aim for 95% success rates. EMS Response Time aims for a median response time of six minutes, 311 Call Center Performance aims for having live agents answer 311 calls within 30 seconds, and BPS Attendance aims for enrolled students to attend school every day during the school year.
Proposal: Address the Blind Spots
The model should focus on a single task at a time and understand that it will occasionally behave with blind spots. The blind spots of a model are typically comparable to the judgments, preferences, and values of the creator. The challenge then becomes whether the creator has succeeded in removing human bias or whether he is merely masking it with technology. While new models are more mathematically sound and sophisticated, they contain a number of assumptions, some of which can be interpreted as prejudiced, uninformed, or misleading.
PredPol is an example of predictive modeling that has come under fire for potentially demonstrating human biases. Jeffrey Bratingham created the tool in 2012 and is confident that the model is blind to race and ethnicity. The tool positions police in parts of the city where there is a higher chance of criminal activity. PredPol is centered around seismic software in that it uses historical patterns when considering crime in a certain neighborhood. The model then can predict the next time and place for future criminal activities. The PredPol model stands out from other recidivism risk models in that it utilizes geography, not the individual.
CityScore is not a predictive technology and therefore does not intentionally create
assumptions. Nevertheless, a common blind spot for technologies concerning urban informatics is that the experiences of people, along with human behavior, cannot always be explained through numbers or models. Model creators should not assume that every urban process is measurable and storable. CityScore is a quantitative model and was not built to account for complex human processes and phenomena. Misleading interpretations of the scoring can decontextualize the city from its past. The Boston Citywide Analytics Team can address these concerns by innovating new technologies and collaborating with tech communities. The CityScore technology and the performance data are all open-source. In hope to inspire other cities to develop their own scoring system, the team has made the CityScore toolkit available on their Github account.
Ontologies
Ontologies help us to answer how CityScore metrics are classified and stored. Dr. Ramesh Srinivasan defines ontologies as “the modes by which knowledge is articulated, expressed, interpreted, and formalized” (204). Most questions about ontologies consider, “poetics, aesthetics, and cognition in the creation of devices, databases, and infrastructures” (Srinivasan 206). Ontologies can be questioned through the different possibilities of systems that use databases to: (1) categorize knowledge, (2) present knowledge through interfaces, (3) and network and acquire that knowledge using algorithms.
Classifying Knowledge Through Databases
Ontologies are expressed through databases, which are storage units that associate its contents with categories that represent them. The preeminent model for database management are relational and hierarchical databases, which store, classify, and transmit data based on rules. While hierarchical databases are practical applications for digital systems, they maintain the hierarchies seen in culture and society because of their inherent neutrality. Their popularity obstructs alternative forms of designs from being brought forward to a global audience. Digital technologies with automated functions are superior tools in society because they transform what are normally strenuous tasks into efficient and scheduled undertakings.
CityScore uses a relational database management system to classify and store metric data. The data used to calculate the score is located in Analyze Boston, the city’s open data hub. The CityScore Full Metric List spreadsheet contains over 33,000 fields, or entries, that span several years. There are 18 attributes, or columns used to categorize the data: field ID, metric name, locational and spatial data of user inputting metric data, the target score, the metric logic, and with the score, numerator, and denominator for the day, week, month, and quarter (“CityScore Full Metric List.”).
Presenting Knowledge Through Interfaces
Ontologies can bring to light the behaviors of city residents and the space which they inhabit, as well as cultural expressions and unusual experiences. Ontologies can create methods to bridge the gap between related systems. By showcasing data and figures that produce a dignified reflection of the city, officials can use dashboards to represent what is and what is not the city. Based on the wide range of CityScore metrics and the eagerness of designers to expand the algorithm, the Citywide Analytics Team is seeking to highlight every aspect of Boston.
Similar to other city-operated data dashboards, information serves institutions like police, fire, and hydrology departments as a means to keep track and predict new incidents. The data that CityScore uses to calculate the daily score is transparent – it is all publicly available on the data dashboard website. 231 datasets operated by the City of Boston are updated daily and published there. As I am writing this, the dataset “Crime Incident Reports - 2021” has 66,353 entries. Like many other datasets in the dashboard, it includes temporal and spatial data: date and time of incidents are recorded, as well the latitude, longitude, street name, and police district.
Analyze Boston’s home page comes equipped with a search engine and four tabs to guide the user: Showcases, Topics, Popular Datasets, and New or Modified Datasets. The Showcases tab allows the user to scroll through 12 data visualization projects, most of which are sponsored by the City. The Topics tab shows that the datasets have been categorized into six distinct areas: Geospatial, City Services, Finance, Environment, Permitting, Economy, Public Safety, and
Facilities.
Acquiring Knowledge Using Algorithms
Algorithms are an efficient means for a system to be updated regularly. After the data manager uploads the “Numerator” or “Current Historical Average” to the database, the algorithm calculates the score for the day and re-calculates the score for the week, month, and quarter.
Proposal: Fluid Ontologies
Ontologies are structures of knowledge that come from understandings of a diverse range of disciplines. Networks, actors, and relationships define the construction of nature, science, and technology. This can reverberate diverse cultures and communities because communities build, interpret, and report ontologies established in a diverse set of goals (Srinivasan 204). However, as we see in the digital landscape, ontologies surface through strict mono-cultures from
corporations and cultural institutions of the West. These systems are increasingly isolated from their audience; Dr. Lucy Suchman refers to this as “detached intimacy” (Srinivasan 204). These institutions have always held immense power over science, technology, and cultural industries in order to silence outside thinkers and perpetuate their dominance.
There are other approaches to ontologies that do not strengthen hierarchical structures. Indigenous ontologies utilize concepts that diverge from standard models in the fashion through which they store and classify data. Fluid ontologies are more localized; they are sets of logical relationships and categorizations that are expressed by members of the community become useful in the design of the database. They are great for expressing understandings of concepts and entities, as well as describing the relationships of the community. While they do not capture processes directly (Srinivasan 215), they would be ideal for capturing urban experiences. Local input would not only create a more accurate city score, it would also empower marginalized communities. Moreover, a fluid ontology model would help cities connect with their inhabitants on a more personal level. In an urban environment, this can be achieved through a wide range of existing technologies, such as social media and virtual communication platforms. However, we must question whether greater access to technology is enough to provide disadvantaged voices and agendas more autonomy, ability, and empowerment, and if access is as straightforward as providing a piece of technology. (Srinivasan 207).
Values in Design
When analyzing the CityScore model, it is important to consider the values that are incorporated into the design of the system. Values illuminate the significance of the metrics used in the model or system. What motivates the creators to develop a model, and more so what motivates them to include certain values into their model, are important questions to ask. Scientist Jacob Metcalf notes that values are not necessarily the same as ethics; ethics are nouns, or prescriptions, while values are verbs, or actions. Design should always be incorporated in such a way in which our assumptions concerning what can be changed and what cannot be changed are challenged.
The article “Embodying Values in Technology: Theory and Practice” elaborates on three modes of design values: Technical, Philosophical, and Empirical (Flanagan et. al 324) and three methods of incorporating values into design: Discovery, Translation, and Verification. Understanding the differences between mode and method can be helpful in this instance; mode does not stress any logical arrangement, while method is procedural and follows an order of operations. Therefore, modes of design values can be interpreted as the principled mindset of the designer, while the integration of values into a design project is a sequence of events. Respectively, they are epistemological and practical (Flanagan et. al 323). Technical mode refers to the implementation of mechanisms by which the values can be achieved. The designers must usher the values into their model while dealing with the limits of their technology. Philosophical mode is the commitment of the designers to legitimize values as objectives or goals with the purpose of emphasizing those that are broadly interpreted as social, moral, and political. Designers should question the origin, source, and extent of the values. Through empirical mode, the designers systematically explore whether the values have been achieved and whether their goals have been met (Flanagan et. al 328).
Philosophical/Discovery
In the context of analyzing CityScore, understanding the Philosophical mode and the design team’s Discovery method are arguably the most effective tools to develop a better scoring system through values. Through Discovery, the designers create a list of values that are applicable to the project. The team should consider values that define the project and values that unfold in key design elements, as well as the values of the designers and the users. The only instance of written values on the CityScore website is their affirmation stating: “CityScore is an initiative designed to inform the Mayor and city managers about the overall health of the City at a moment’s notice by aggregating key performance metrics into one number. Here we will provide you with an overview of the CityScore tool and data, but more importantly we will show you how we are using CityScore to make improvements across the City” (“CityScore.”). This statement may guide the user with concerns they may have about the source, origin, and overall purpose of the technology. An ideal world can use technologies to advance instrumental values (safety, reliability, and efficiency) in addition to social, moral, and political values. (Flanagan et. al 325). The designers of the system are responsible for considering these values when constructing the model; there must be an understanding of how the values operate in the daily lives of the people and groups who are impacted by the model. CityScore has the potential to help people and cities. Should CityScore aim to be an overarching digital infrastructure, or just a tool?
Technical/Translation
The second step of enhancing project design through values is Translation. This mostly concerns the project engineers and computer scientists who need to operationalize, implement, and resolve values and values in conflict. While CityScore was first and foremost intended to enlighten city officials on the health of the city, it is a public good and should be designed with Bostonians in mind.
Values in liberal democracies that embrace technology can include: “liberty, justice, enlightenment, privacy, security, friendship, comfort, trust, autonomy, and sustenance” (Flanagan et. al 322). The score, which was designed originally for city officials, has had the potential to magnify all of those values because it can hold our leaders accountable. Nevertheless, it is important for the designers to build their technologies with values in mind because the end result (i.e., a city with the ideal values brought forward by Flanagan) is never guaranteed.
Boston officials have touted CityScore as a technology that will make Boston a “smarter” city. Rhetoric centered around smart cities is somewhat controversial in the urban planning field. It is a form of techno-centric urban development with an appeal to affluent consumers and workers. Informatics researchers Cory Knobel and Geoffrey Bowker describe how some GPS technologies are successful infrastructures for they align with users’ ideals about privacy and security. The output is not tied to a person, but rather the space through which people occupy. Unlike a phone call, GPS-enabled network apps contain information about a specific physical place; they may boost locational responsibility. When geographic anonymity and discretion are lost, an "open hand" of location-based transparency may easily become a "backhand" (Knobel and Bowker).
Empirical/Verification
The last step, Verification, is for determining whether the implementations meet the intentions of the designers. Verification can be achieved through testing, which can be performed through user testing, designer testing, surveys, and interviews (Flanagan et. al 344). The CityScore website includes a hyperlink button near the bottom of the page that takes the user to a three-question survey hosted on Google Docs. The first two questions ask the user to select a number between 0 (very unlikely) and 10 (very likely). The first question asks, “How likely are you to use CityScore to understand how the City is performing?”. The second question asks, “How likely are you to tell people you know to check out CityScore?”. The third question asks “We will be adding new measures to CityScore. Which areas would you like to see most of?” and subsequently allows the survey participants to select up to 10 topics or write a response in the “Other” category. The proposed metrics include Basic City Services, Civic Engagement, Economic Development, Education, Environment, Finance & Budget, Health & Human Services, Housing, and Public Safety (“CityScore Survey”).
Proposal: Complementary Data Visualization Technologies
CityScore, as a standalone tool, has limited usages. The extent of the project is indeed a limiting factor, yet it has many more possibilities. If one of the roadblocks for the CityScore designers is that the model cannot be expanded due to value limits, then the city should work to create new programs that complement the scoring system and build off of them.
Users have the ability to download sets of Boston city data at will, however the data dashboard does not provide a platform for users to visualize datasets. It is fairly easy to host and maintain a data visualization application - the city already operates hundreds of ArcGIS maps for users to explore. While the data points of those maps are static and rarely require an update from the host, they are not tied to any person or their actions. What if the city decided to make a map for one of CityScore’s metrics that are criminal in nature, such as daily stabbings?
The city has the data on stabbings available for all to see, but currently the GIS technology is limited to the Boston Police Department and city officials. If it were to be made public, it could be advantageous to city goers and damaging to the highlighted communities. With dots that represent stabbings, the map would signify to people that certain streets and neighborhoods are more dangerous than others. The map could lead to a reduction of stabbings and bring about a positive change in public safety, but it could also discourage the mobility of city residents and thereby hinder local economies. As for the city officials who campaigned on public safety, the map would have the potential to curb their chances of re-election.
Conclusion
CityScore, a dynamic and algorithmic data aggregator and public dashboard used to assess the well-being of Boston, Massachusetts, can be examined through the model’s structure, ontologies, and values in design. There are three things that Boston’s Citywide Analytics Team can do to improve CityScore: (1) address the blind spots of the algorithm, (2) utilize a fluid ontological approach, and (3) create complementary data visualization technologies. The algorithm’s blind spots are rooted in the fact that it cannot take into consideration the personal experiences of its users and the groups through which the data is collected from. In addition, a fluid ontological model can increase the amount of data necessary to obtain the most accurate score while also bolstering local communities and participation. The team should also work to develop new projects that utilize values in different instances, all while incorporating the scoring system into the analysis.
References
“CityScore.” Boston.gov, 30 June 2016,
“CityScore Full Metric List.” Analyze Boston,
“CityScore Survey.” Google Docs.
Flanagan, Mary, Daniel C. Howe, and Helen Nissenbaum. "Embodying values in technology: Theory and practice." Information technology and moral philosophy 322 (2008).
O'neil, Cathy. Weapons of math destruction: How big data increases inequality and threatens democracy. Broadway Books, 2016.
Knobel, Cory, and Geoffrey C. Bowker. "Values in design." Communications of the ACM 54, no. 7 (2011): 26-28.
Srinivasan, Ramesh. “Re-thinking the Cultural Codes of New Media: The Question Concerning Ontology”, New Media and Society, 2012.